 Show
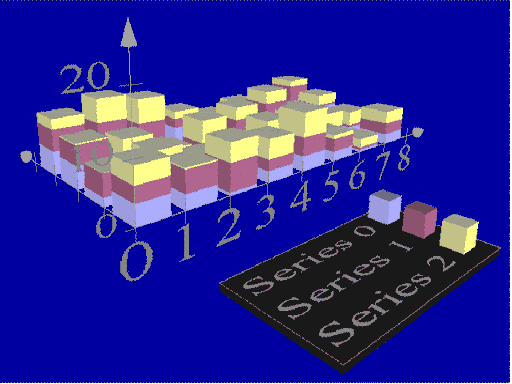
me the money! Or at least visualize it in 3D. Visualizations of financial
information falls into the domain of information visualization (infoviz).
The challenging aspect about infoviz is trying to visualize abstract information.
A financial transaction doesn't have an inherently physical manifestation
like for example a tumor in a brain, or a geographic location on a map.
Information in many cases has no obvious physical representation. That's
what makes it so cool, and hard. Tamara Munzner a VRML goddess from way
back, has put together a terrific resource on information
visualization. A very nice survey
of infoviz is available on the web courtesy of Peter Young in England.
VRML as applied to financial and business applications is the specialty of a few companies. Notable among these are Visible Decisions Inc. (VDI) and Transaction Information Systems (TIS). VDI is not a recent start-up and has been around since 1992, making them downright old in this business. A quote on one of VDI's web pages summarizes the situation aptly:
Check out VDI's Gallery page for some very cool examples of stock market monitoring, risk analysis, profit and sales discovery and lots more. There are three animated gifs of their interactive systems such as the Stock Ticker. All of these are 3D graphics, and can be output to VRML.
Transaction Information Systems is a systems integration outfit that has produced a number of interesting VRML visualizations of financial systems. Check out the Hot Demos page on their web site for the detail. In addition to simple VRML applications, more significantly, they have produced an interactive VRML site integrated with Lotus Domino. The S.W.A.T. Strategic Web Application Team demo, while not a financial application, illustrates how to integrate a robust data management system such as Lotus' Domino with VRML.
A nice early example of animated 3D charting is still around at the vruniverse site. It let's you pick from several years of make-believe data and the bar chart animates. Another very effective data illustration is the US Population Growth demo which turns a map of the U.S. into a 3D bar chart. This was based on an old SGI Inventor demo and illustrates how cool demos never die they just migrate to new formats!
That about covers it for this week...happy hallucinations...oops I mean
visualizations.
Previous
Features